Introduction
ChatGPT cannot embed pictures in conversations, but it is still possible to draw diagrams and charts like flowcharts, sequence diagrams, Gantt charts and many others.
There are tools such as mermaid.js (or, just Mermaid) that enable this. Quoting the official introduction about Mermaid:
… is a JavaScript based diagramming and charting tool that renders Markdown-inspired text definitions to create and modify diagrams dynamically.
So with Mermaid, you just need to ask ChatGPT to write Mermaid code to draw diagrams. Then copy the code and paste it in Mermaid Live Editor, you’ll get the diagram.
Examples
Example 1 (Sequence diagram)
Example of making HTTP request in js:
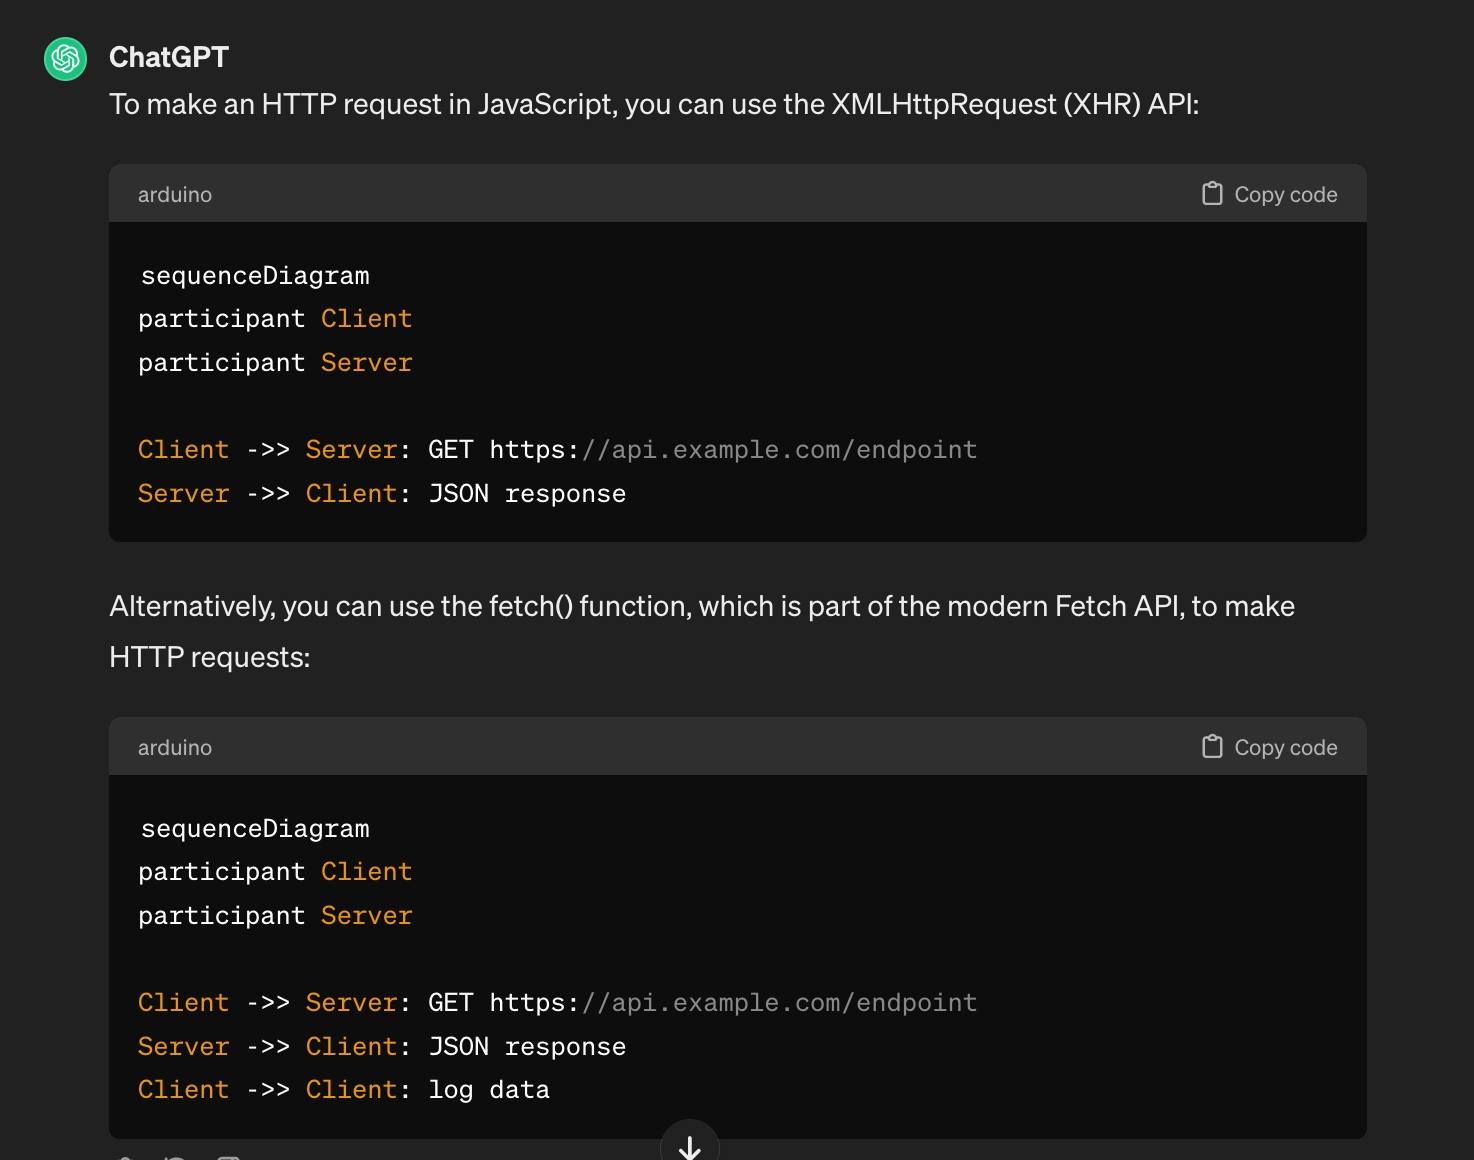
Q: How do I make an HTTP request in Javascript? Explain with diagram in mermaid.js syntax.
ChatGPT:

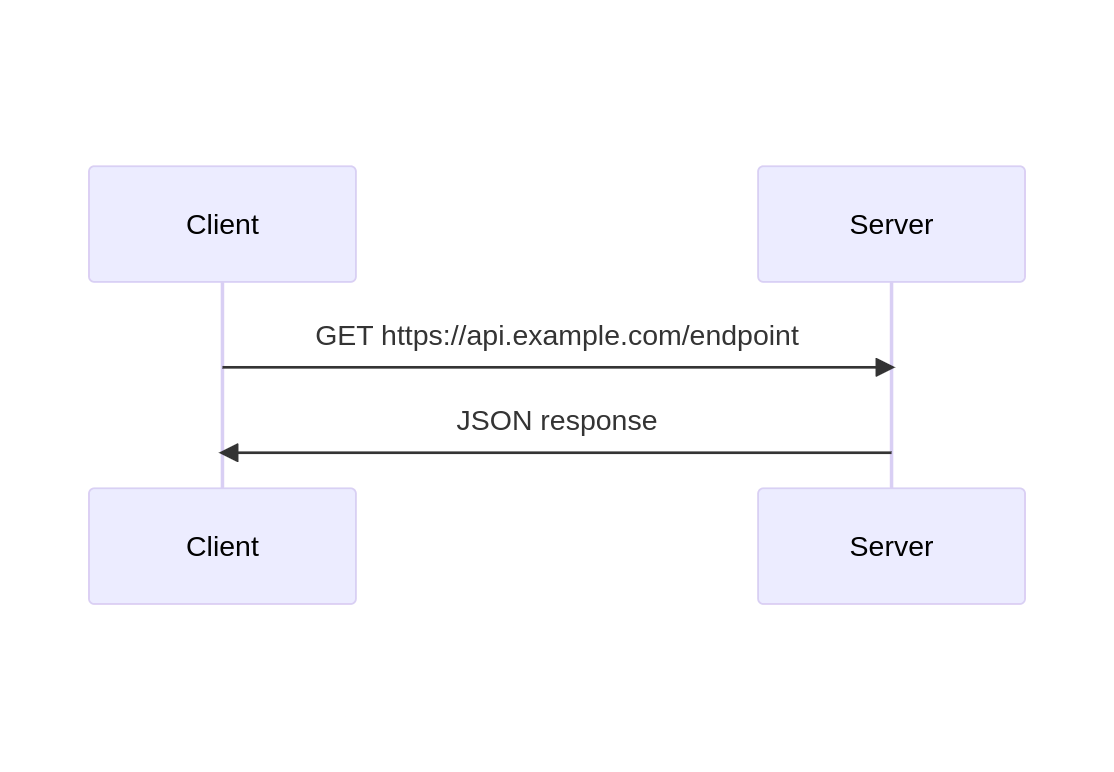
Code snippet 1:
| |
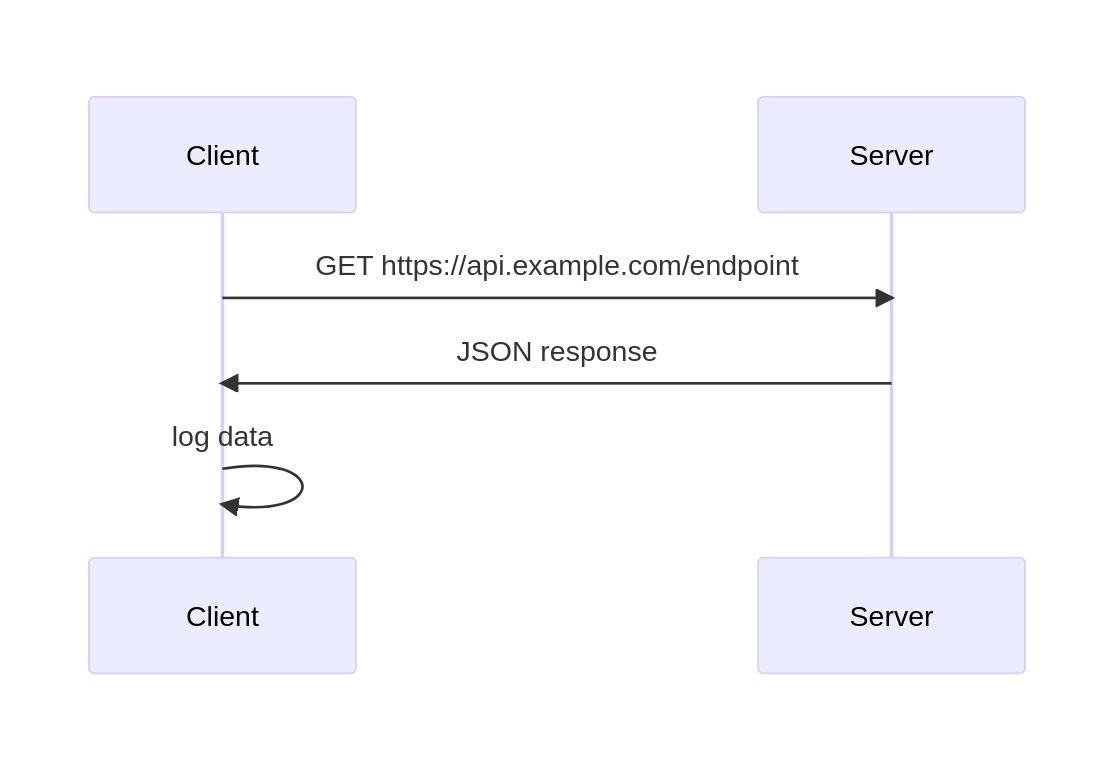
Code snippet 2:
| |
Output of snippet 1:

Output of snippet 2:

Example 2 (State diagram)
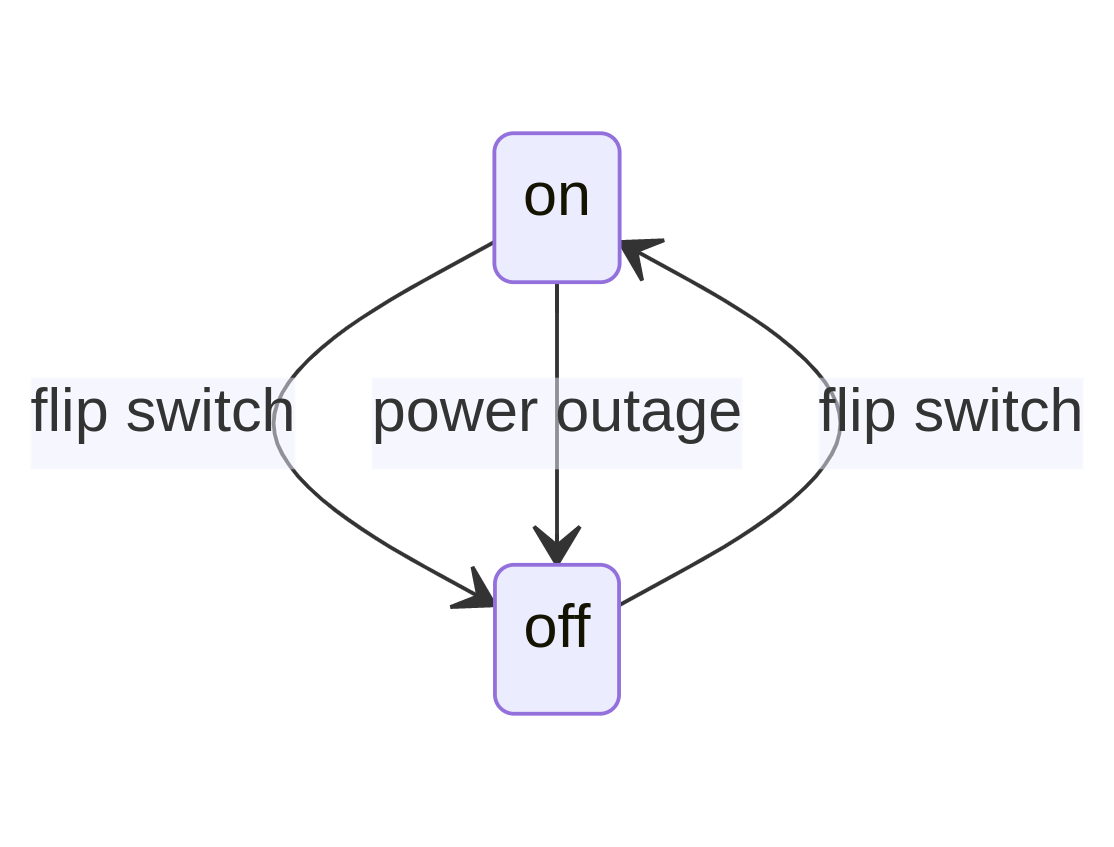
Example of a state machine that represents a light switch with two states: “on” and “off”:
| |
Output of Example 2:

Conclusion
These are just some examples of making diagrams with ChatGPT (and Mermaid). You can leverage their combination to learn about something, with diagrams. Or you may also want to create diagrams for…your report!
If you want to learn about the capabilities of Mermaid, visit: https://mermaid.js.org/.
Update on 2024-03-13: Updated example 1 with screenshot of ChatGPT’s answer, by asking it to repeat its own answer, just for the sake of screenshot. 😂